I mean, I really like charts.
One could go so far as to consider me a connoisseur of charts.
And while, no doubt my charts are the best charts that ever were charted, I have to admit that The Economist comes out with some really kick ass charts that I occasionally liberate from them.
One such chart is the one below; the Worker's Tax Wedge.
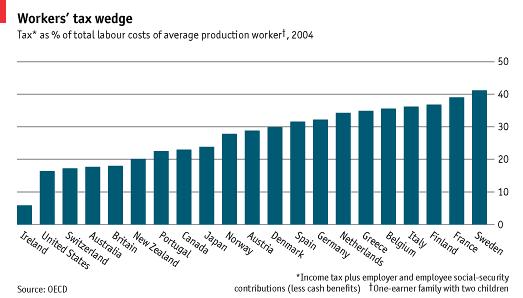
What the tax wedge shows us is the percentage of labor costs that are due to taxes. Specifically income taxes plus the social security contributions of BOTH the employer and the employee. In other words, the difference between what the employee takes home and what it costs to employ him.
A rough translation of the figures above would mean Sven in Sweden makes $10 an hour, but only takes $6 home. And Seamus in Ireland who is paid the same $10 an hour wage takes $9.50 home.
Of course this is a rough translation, as it ignores the fact that the employer also has to pay taxes on employing labor, namely in the form of social security contributions (and in other countries, payments into health care programs, etc.) Thus, the higher the tax, the less incentive a company or employer has to set up shop there. Or perhaps looking at it the other way, the more the governments of Sweden, France and Germany demand their employers (and employees) pay in taxes, the more they incentive corporate investment and talented labor to move offshore and flee to the likes of Ireland or the United States.
This, in theory, should result in lower economic growth rates for those countries that tax their labor higher. Of course those on the left will never admit such things occur and dismiss such theories as right wing tripe, highlighting Sweden and Norway as examples of socialist success.
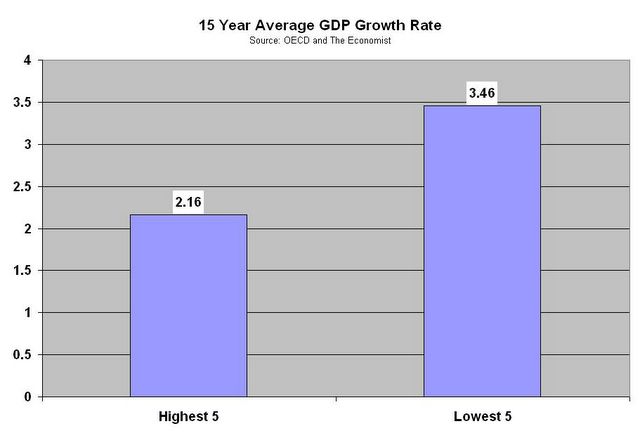
But, you guys know me. I'm not much of one for theories. I'm more concerned about data and statistics. Which is why I took the countries in the above chart with the 5 highest tax wedges and compared them to the 5 countries with the lowest tax wedges in regards to economic growth. Specifically their 15 year average GDP growth rates.
Now I know that to be thorough about it, I should really do an average tax wedge over 15 years, run some correlations, etc. etc., but you know something? I'm just too damn lazy. And until somebody from the left cares to do a more thorough job in crunching these numbers to debunk me, I think my case stands.
No comments:
Post a Comment